First Gen’s financial capital is composed of internally generated funds from its operations and funds obtained from its capital raising. It is managed with the objective of maximizing stakeholder value through the attainment of optimal economic outcomes that should result in positive social outcomes.
The Company leverages its financial capital to increase overall stakeholder value. Working with our stakeholders, shareholders, and affiliates, we work to ensure that we employ our capital towards the most cost-efficient and high-return projects. First Gen monitors these investments to ensure that the Company is able to deliver optimal value as it achieves its growth and income aspirations. As a result, First Gen regularly pays dividends after allocating cash for debt payments and funding growth projects.
The Company heavily utilizes its financial models to project cash and income streams, evaluate the potential returns on our new investments and to optimally allocate financial capital. These models are likewise used by First Gen to aid its decisions in capital raising.
Communications with investors play a critical part in the procurement and deployment of financial capital. These communications are overseen by our Investor Relations team, ensuring that all financial stakeholders understand, align with, and support the Company’s Mission and Purpose. At the same time, the Investor Relations team also ensures that our stakeholders have timely updates and are given opportunities to express their concerns about First Gen’s investments.
The Investor Relations team maintains active relations with our shareholders, ensuring that their feedback gets reported back to Senior Management for transparency and trust. First Gen is committed to ensuring that our relationships with our financial partners are built on a foundation of transparency, communication, and fiscal responsibility, while also aligning with our own ESG initiatives.
In 2023, 92 percent of First Gen’s total generated economic value was invested into the economy in the form of operating costs, employee wages and benefits, payments to providers of capital, and payments to the government. The Company also made investments in the community by implementing health, education, livelihood, environment, emergency response and relief, and socio-cultural programs.
The table on the right shows how our financial capital is distributed and transformed into the five other capitals.
| Direct Economic Value Generated, Distributed, and Retained (in USD Millions) |
2023 |
2022 |
2021 |
| Economic Value Generated |
2,517.8 |
2,677.7 |
2,205.1 |
| Economic Value Invested |
2,319.9 |
2,523.7 |
2,400.6 |
| Economic Value Retained |
197.9 |
154.0 |
(195.4) |
Capital
(in usd millions) |
2023 |
2022 |
2021 |
| Manufactured |
491.4 |
357.3 |
316.1 |
| Natural |
1291.4 |
1616.1 |
842.4 |
| Intellectual |
236.2 |
8.2 |
10.3 |
| Human |
120.7 |
123.1 |
111.4 |
| Social and Relationship |
19.1 |
19.2 |
7.6 |
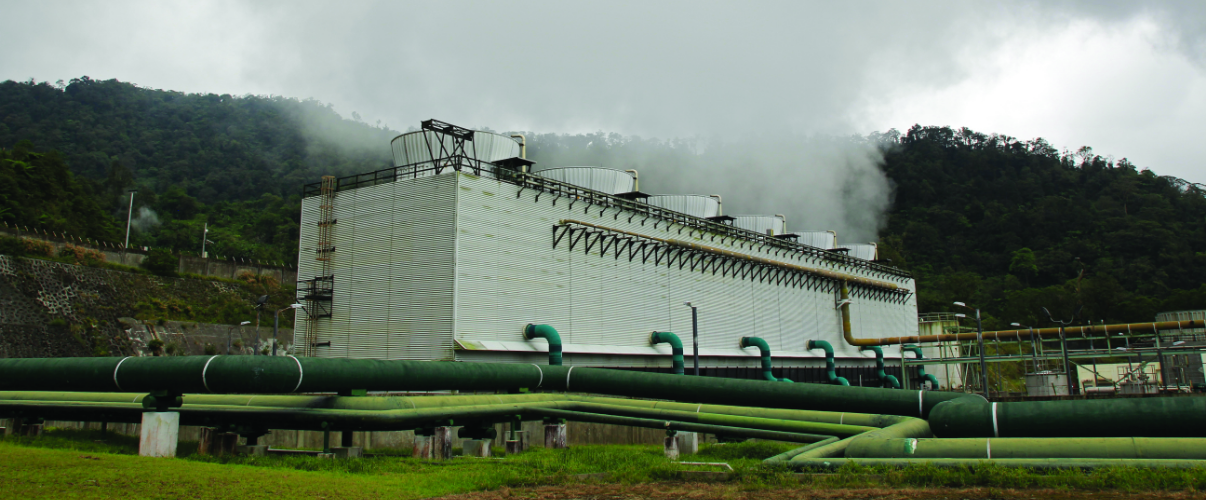
We directed investment efforts towards natural capital (which represents 59.8 percent of operational expenses and investments) to secure power supply in the grid. This was accomplished through land procurement and upkeep, obtaining permits, complying with environmental regulations, implementing CSR projects and initiatives, enhancing resource efficiency, and implementing water and waste management practices.
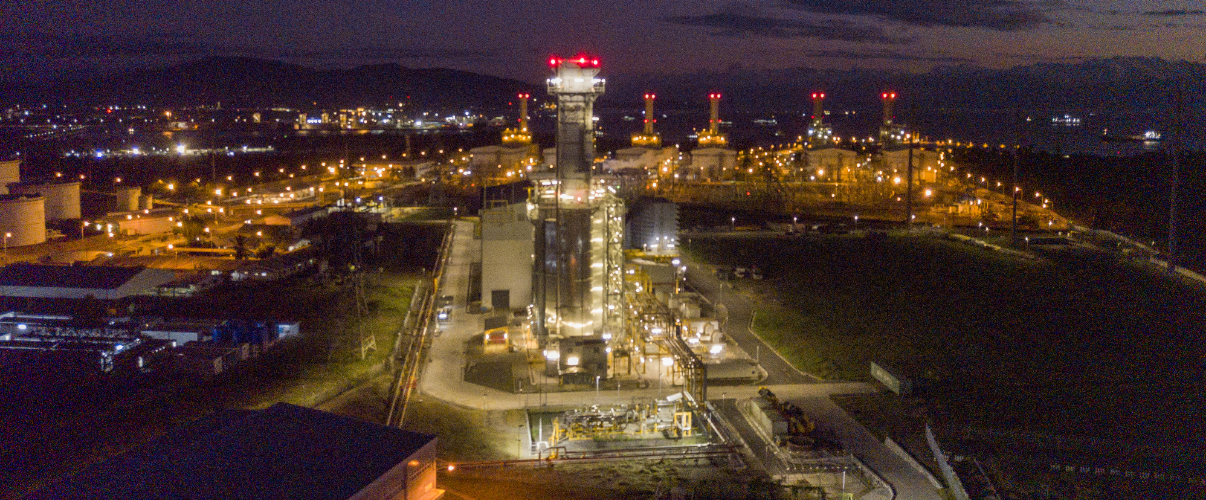
In addition, we invested 22.8 percent of operational costs and investments in manufactured capital. This was used for the construction of the LNG Interim Offshore Terminal (IOT) Project to address the depletion of the Malampaya gas field; the construction of the Palayan Bayan, Bago, Tanawon, and Mahanagdong geothermal plants; procuring and installing new equipment; operating and maintaining power plants; and improving buildings towards resiliency. The above projects are slated for completion in 2024.
First Gen invested 10.9 percent of total operational costs and investments in intellectual capital, which includes lease rights to the Floating Storage and Regasification Unit (FSRU) and tugboats, IT software and tools, branding and marketing, cybersecurity measures, research and studies, and securing ISO certifications.
First Gen also prioritizes our employees, allocating 5.6 percent of total operational costs and investments for their welfare. The Company provides occupational health and safety training, as well as medical and psychosocial programs. Additionally, the Company invests in the growth of our employees by providing skills development, training programs, and subscriptions to learning platforms like Udemy.
Lastly, the remaining 0.9 percent is allocated to social and relationship capital to strengthen First Gen’s relationships with local communities and other stakeholders. The Company adheres to community and LGU regulations, conducts CSR activities, donates to social causes, networks with associations, sponsors events, and pays membership fees.
Here is a table highlighting the overall financial performance of the Company as a whole.
In 2023, First Gen reported a Recurring Net Income Attributable to Equity Holders of the Parent of USD277.0 million, which is USD11.6 million or 4.4 percent higher than the previous year. This was primarily driven by the geothermal platform’s higher average selling prices and lower replacement power purchases, supplemented by San Gabriel’s higher capacity fees from operating on full capacity. However, consolidated revenues decreased by 7.2 percent to USD 2.5 billion in 2023 due to lower fuel revenues from the gas platform from lower fuel prices and lower dispatch of Santa Rita and San Lorenzo.
|
Financial Capital Highlights
(in USD Thousands)*
*except per share data |
2023 |
2022 |
2021 |
| Revenues |
2,474,748 |
2,666,706 |
2,166,782 |
| Consolidated Net Income |
449,333 |
369,512 |
354,240 |
| Net Income Attributable to Equity Holders of the Parent |
312,204 |
261,390 |
258,253 |
| Recurring Net Income Attributable to Equity Holders of the Parent |
277,036 |
265,446 |
252,437 |
| Total Assets |
6,126,657 |
5,375,868 |
5,503,389 |
| Total Liabilities |
2,825,531 |
2,416,251 |
2,530,186 |
| Equity Attributable to Equity Holders of the Parent |
2,676,172 |
2,413,980 |
2,438,010 |
| Non-Controlling Interests |
624,954 |
545,637 |
535,193 |
| Basic/Diluted Earnings Per Share for Net Income Attributable to Equity Holders of the Parent (in USD/share) |
0.087 |
0.071 |
0.070 |
The natural gas platform reported an increase in net income of 3.1 percent, or USD5.6 million, from USD182.0 million in 2022 to USD187.6 million in 2023. This was due to San Gabriel’s higher income contribution from better net dependable capacity and fewer forced outages in 2023, resulting in higher capacity fees and lower replacement power purchases. However, the increase was partly offset by San Lorenzo’s and Santa Rita’s higher interest expenses from higher interest rates in 2023.
NATURAL GAS BU
(IN USD THOUSANDS) |
2023 |
2022 |
2021 |
| Revenues |
1,619.0 |
1,756.7 |
1,297.2 |
| Operating Income (Loss) |
265.8 |
259.2 |
258.7 |
| Net Income (Loss) |
187.6 |
182.0 |
199.3 |
In 2023, First Gen’s geothermal platform recorded a substantial increase in net income amounting to PHP16.6 billion, a growth of 57.7 percent from the previous year’s PHP10.6 billion. This growth can be attributed to higher average selling prices for both the WESM and its power supply contracts. The geothermal platform also saw higher generation from the Tongonan, Palinpinon, Bacman, and Mindanao plants in 2023.
GEOTHERMAL BU
(IN PHP MILLIONS) |
2023 |
2022 |
2021 |
| Revenues |
41,487.3 |
42,677.0 |
34,157.7 |
| Operating Income (Loss) |
19,375.9 |
15,002.8 |
9,777.0 |
| Net Income (Loss) |
16,646.3 |
10,554.2 |
7,521.3 |
Pantabangan-Masiway’s revenues decreased by 47.5 percent, or PHP1.9 billion, to PHP2.1 billion in 2023, compared to PHP4.1 billion in 2022. This decline is attributed to reduced revenues from power supply agreements. In particular, FG Hydro transferred its contract with Meralco to EDC in August 2022 as part of a previous arrangement. The decreased revenues were also attributable to a decline in generation resulting from low reservoir elevation. This decline in revenues was partially offset by fewer purchases of replacement power from the WESM in 2023, due to lower volumes required by the contract with Meralco in 2022. This resulted in a lower net income of PHP325.6 million in 2023, a 14.7 percent decrease from the same period last year.
FG Bukidnon’s revenues increased by 6.3 percent to PHP45.3 million in 2023 from PHP42.6 million in 2022. This is due to higher average selling prices in 2023. Nevertheless, FG Bukidnon’s net loss continued to increase due to higher operating expenses.
|
2023 |
2022 |
2021 |
| PANTABANGAN-MASIWAY BU (IN PHP MILLIONS) |
| Revenues |
2,132.8 |
4,061.4 |
4,937.2 |
| Operating Income (Loss) |
239.4 |
356.1 |
296.8 |
| Net Income (Loss) |
325.6 |
381.7 |
281.5 |
| AGUSAN BU (IN PHP MILLIONS) |
| Revenues |
45.3 |
42.6 |
50.9 |
| Operating Income (Loss) |
(10.3) |
(7.4) |
(0.2) |
| Net Income (Loss) |
(11.1) |
(7.1) |
(1.2) |
| TOTAL |
| Revenues |
2,178.1 |
4,104.0 |
4,988.1 |
| Operating Income (Loss) |
229.1 |
348.6 |
296.6 |
| Net Income (Loss) |
314.6 |
374.6 |
280.3 |
Burgos Wind’s net income increased by 83.7 percent, or PHP0.5 billion, from PHP0.6 billion in 2022 to PHP1.1 billion in 2023, due to a stronger wind regime and higher FiT rates in 2023. Meanwhile, Burgos Solar’s net income decreased by 9.5 percent, or PHP4.2 million, from PHP44.0 million in 2022 to PHP39.8 million in 2023, due to lower generation sales in 2023.
EDC Siklab’s net income decreased by 40.5 percent, or PHP3.0 million, from PHP7.5 million in 2022 to PHP4.5 million in 2023. This decrease was attributable to the lower volume of generated power.
|
2023 |
2022 |
2021 |
| WIND BU (IN PHP MILLIONS) |
| Revenues |
3,471.8 |
2,917.2 |
3,941.8 |
| Operating Income (Loss) |
1,760.0 |
1,314.7 |
2,419.8 |
| Net Income (Loss) |
1,061.7 |
578.0 |
1,822.0 |
| BURGOS SOLAR BU (IN PHP MILLIONS) |
| Revenues |
103.5 |
102.7 |
109.9 |
| Operating Income (Loss) |
52.3 |
56.8 |
63.0 |
| Net Income (Loss) |
39.8 |
44.0 |
50.9 |
| SOLAR ROOFTOP (IN PHP MILLIONS) |
| Revenues |
27.9 |
32.2 |
31.4 |
| Operating Income (Loss) |
5.7 |
8.7 |
8.1 |
| Net Income (Loss) |
4.5 |
7.5 |
7.1 |